Picking the best crypto indicators can significantly improve your trading success by revealing hidden market trends, crucial support and resistance zones, and possible shifts in momentum. Whether you’re a beginner testing your first strategy or a seasoned trader refining advanced techniques, knowing the fundamentals of technical analysis is an essential step. Unlike fundamental analysis, which digs into a crypto’s underlying project or tokenomics, technical analysis focuses on historical price data, trading volume, and chart patterns.
This approach is especially useful in the crypto market, known for dramatic price fluctuations and unprecedented volatility. The following guide showcases several high-impact indicators—both simple and complex—and offers a foundation on how to integrate them into a profitable, adaptable trading strategy. By monitoring indicators tailored to price movements you can create more informed trading decisions regarding the best times to enter or exit a position. Let’s get into it.
What is Technical Analysis?
Technical analysis focuses on assessing specific historical data, like trading volume or price movements, to better predict upcoming price movements. By interpreting recurring patterns in candlestick charts, trend lines, and various oscillators, traders gain a clearer view of market momentum or potential reversals.
Unlike fundamental analysis, which examines a crypto project’s core technology or partnerships, technical analysis primarily hones in on chart patterns and statistical metrics. Traders will frequently combine multiple indicators to refine their strategies, mitigate false signals, and adapt to market volatility.
For instance, a moving average might highlight a trend’s direction, while an oscillator like the relative strength index (RSI) can help highlight overbought or oversold conditions. But when combined, these tools are capable of cutting through the market noise so you can make more objective, timely decisions. That said, no chart or formula can completely eliminate risk, and every single trade will still require thoughtful risk management and personal discipline.
Types of Indicators for Crypto Trading
Now we’re going to take a look at a wide range of technical indicators and chart concepts crucial for spotting price movements, gauging market momentum, and planning a well-rounded trading strategy. Each tool helps you interpret historical price data differently, so combining several indicators can reduce false signals and refine entries or exits.
1. Line Charts
A line chart displays a crypto’s closing price over time, forming a continuous line that helps visualize the overall trend. Because it only tracks one data point (typically the close price), it offers a clear, uncluttered view of market direction. Traders often start with line charts to identify broad trends before diving deeper.
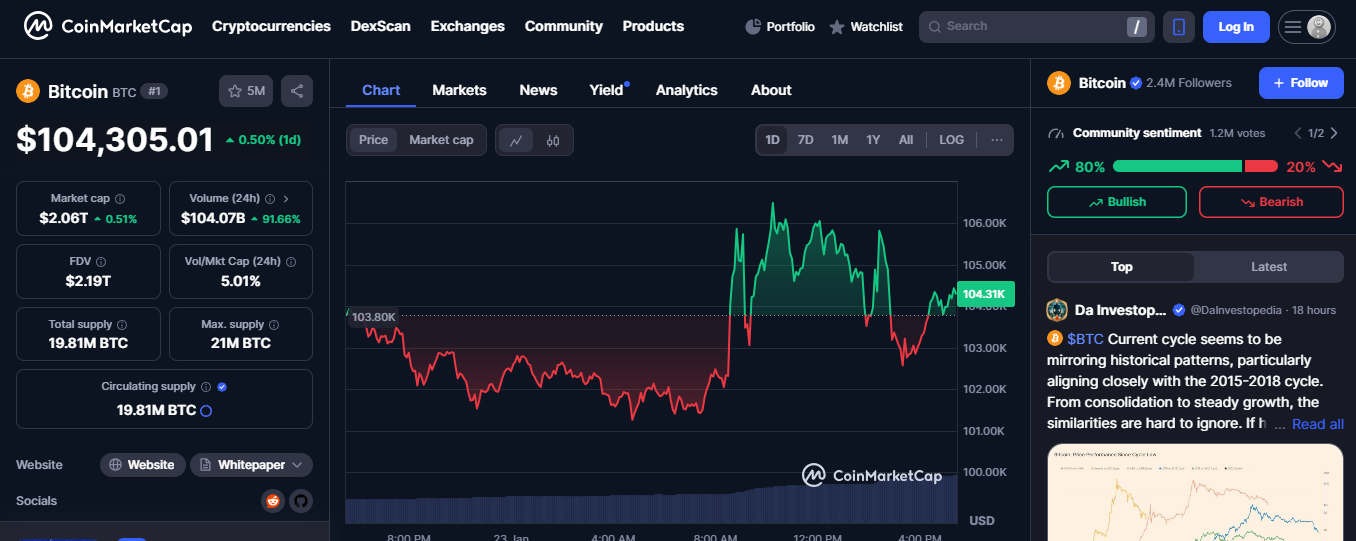
Source: CoinMarketCap
2. Bar Charts
:max_bytes(150000):strip_icc():format(webp)/BTCBarChart-47451c53e9e746958f52c9dac2e4d07a.jpg)
Source: TradingView
Bar charts expand on line charts by showing each period’s open, high, low, and close (OHLC). Each bar represents a time interval, displaying intraday fluctuations more precisely. The left tick marks the open price, while the right tick shows the close. By seeing highs and lows, you can gauge buying and selling pressure more accurately.